credit: Kristina Jackson
A Unified Biomarker for a Patchwork of Studies
For years, researchers measured “omega-3 status” in many different ways—plasma here, serum there, whole blood or red cells somewhere else; sometimes EPA+DHA, sometimes EPA+DHA+DPA. That patchwork made it hard to compare results across studies or countries. In their new analysis, Stark et al. tackled this head-on by standardizing everything to a single, well-defined measure.
Why the Omega-3 Index Was Chosen
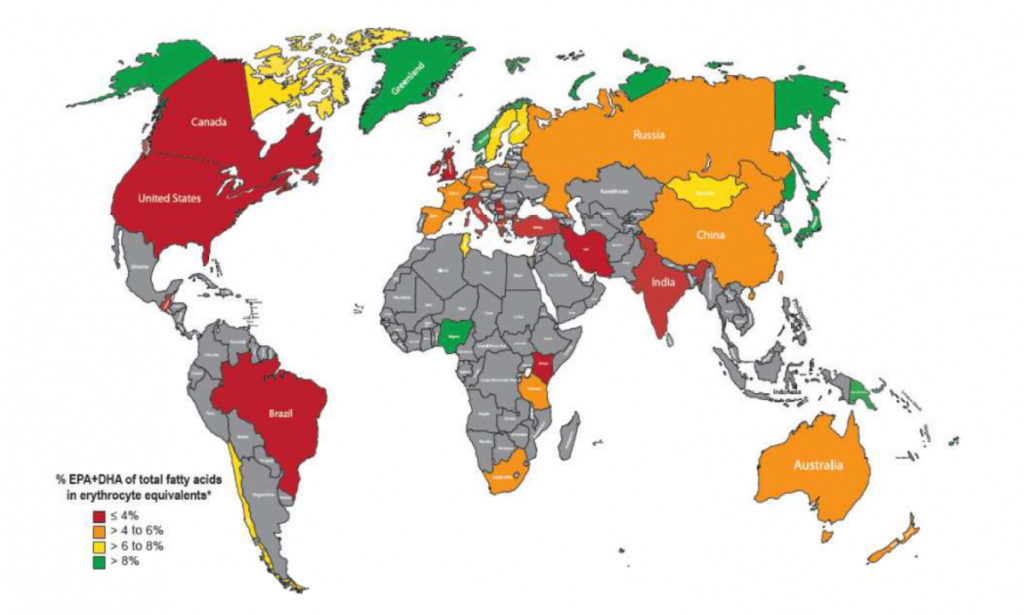
To enable apples-to-apples comparisons worldwide, the authors re-expressed available data as EPA+DHA in erythrocytes, better known as the Omega-3 Index. They noted this metric is the best characterized in the literature and therefore the most defensible reference for global benchmarking. In effect, the paper elevates the Omega-3 Index as the preferred biomarker for defining human omega-3 status.
What the World Map Reveals
Countries ringing the Sea of Japan, much of Scandinavia, and regions where indigenous diets remain largely non-Western show high Omega-3 Index values. Conversely, North and South America, parts of the Middle East, and India tend to cluster at the low end. These patterns closely mirror dietary habits: regions with frequent consumption of oily fish typically display higher tissue levels of EPA and DHA.
Why This Matters for Research Quality
By converging on the Omega-3 Index, investigators can pool data more reliably, compare cohorts across borders, and interpret outcomes against a common biological scale. This consensus reduces confusion from mismatched specimens and fatty-acid panels and accelerates clearer answers to questions about omega-3s and health.
Clinical Implications and Next Steps
A single, practical biomarker also paves the way for routine use in healthcare. As OmegaQuant has long emphasized, the Omega-3 Index is straightforward to interpret, responsive to diet and supplementation, and directly tied to tissue omega-3 content. Stark et al.’s work strengthens the case for adopting the Omega-3 Index not only in research protocols but also in everyday patient care.